.png)
_comp.jpg)

.png)
What does reducing emissions to net-zero mean for the Northwest?
Achieving net-zero emissions requires reducing emissions to as close to zero as possible with technically and economically viable strategies and balancing any remaining emissions with an equivalent amount of carbon removal. Emissions can be reduced by targeting how much energy is consumed (demand) or where emissions come from the energy consumed (supply).
Demand-side measures include energy efficiency and fuel switching (electrification as well as low-carbon fuels). On the supply-side, the NZNW Energy Pathways model calculates the least-cost way to provide the energy needed with a variety of technologies while still meeting the net-zero emissions goals.
Key emissions findings include:
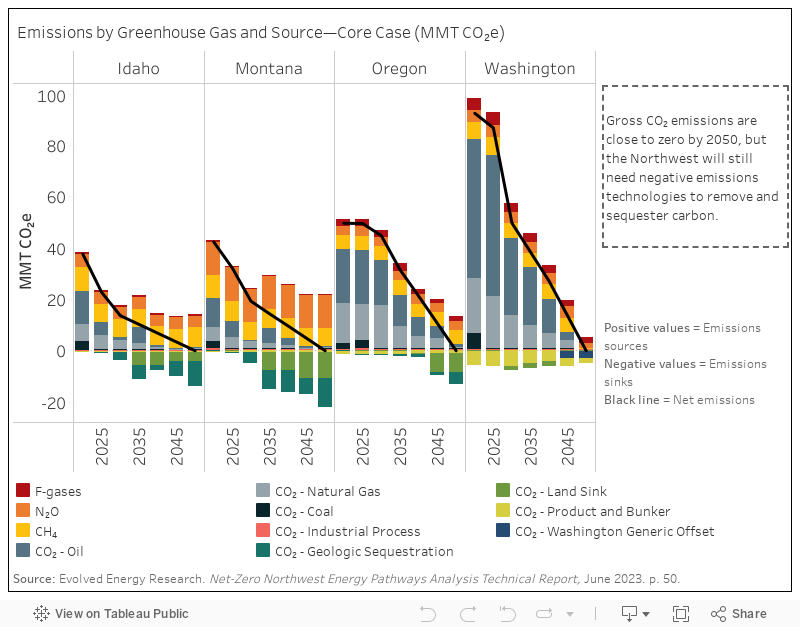
We can reduce gross CO2 emissions from energy and industry to get close to zero by 2050, but it is not possible with current technologies to reduce non-CO₂ emissions to zero without significantly changing economic activity in agriculture and industrial processes.
The Northwest will need early investment in negative emissions technologies to remove and sequester carbon.
Achieving 2030 targets in states with large agriculture sectors requires carbon sequestration and clean fuels, which may face feasibility challenges.
The analysis includes both carbon dioxide (CO2) emissions as well as non-CO2 emissions, and the ways they can either be reduced through investments to make their sources cleaner or offset with negative emissions technologies. Least-cost pathways to net-zero in each scenario therefore account for all sources of greenhouse gas emissions, the potential to reduce them, and how much it costs to do so.
The NZNW Energy Pathways analysis focuses on achieving annual targets applied to anthropogenic emissions, as reported in state emissions inventories, and calculates the CO2 and carbon dioxide equivalent (CO2e) contributions from all global warming gases toward emissions in each modeled year.
Non-CO2 emissions come from agricultural production and high-intensity industrial processes. The model uses the U.S. Environmental Protection Agency (EPA)’s non-CO2 mitigation supply curve measures, which provide projected estimates of non-CO2 emissions as well as reduction potentials.
To achieve negative emissions reductions that can offset the remaining gross emissions, the model incorporates negative emissions technologies that include land-use measures, bioenergy with carbon capture and storage (BECCS), and direct air capture (DAC).
Please see NZNW Emissions Results for a full discussion of the assumptions, modeling, and impact on emissions of achieving net-zero emissions by 2050 in the Northwest.
Where Do We Start from in the Northwest?
The study uses a target of net-zero emissions by 2050 in the four Northwest states, with a reference year of 1990 that draws from each state’s emissions inventory.
Total emissions for Oregon, Washington, Montana, and Idaho are estimated at nearly 236 million metric tons (MMT) CO2e in 2021 based on a combination of recent and forecasted state emissions inventories. Northwest emissions comprise approximately 4% of U.S. total annual emissions and approximately 20% of emissions in the 11 Western states.
Based on state emissions inventories, over 20% of these emissions are non-CO2 emissions, largely from agriculture and certain industrial processes.

Energy-related CO2 emissions comprise 75% of greenhouse gas emissions in the Northwest and include emissions from fossil fuel combustion in residential and commercial buildings, industrial processes, transportation, and electricity generation.
The transportation sector accounts for nearly half of all energy-related CO2 emissions in the Northwest due to liquid fuel consumption: gasoline in passenger vehicles, diesel fuel in freight transport, fuel for marine transport, and jet fuel for aviation.
Electricity sector emissions come from the combustion of fossil fuels, such as coal and natural gas, for electricity generation.
The residential, commercial, and industrial sectors produce emissions from the direct consumption of fossil fuels (e.g., natural gas–fired furnaces).
The industrial process and agriculture CO2 emissions are the remaining CO2 emissions from non-energy sources (agriculture and high-intensity industrial processes).
Non-CO2 greenhouse gas emissions from agriculture and industrial processes include methane from agriculture and waste, as well as hydrofluorocarbons and other high-intensity industrial emissions.
The Washington State Legislature established aggressive economy-wide greenhouse gas reduction targets in 2020: a 95% reduction below 1990 levels in gross emissions by 2050, with interim economy-wide emissions limits of 45% below 1990 levels by 2030 and 70% below 1990 levels by 2040. In addition, the state committed to net-zero emissions by 2050.
Washington’s targets require transformative change and aggressive action. Hitting the 2030 target means a 53% reduction over 2019 energy and industry CO2 emissions. Because the state’s electricity sector is already very clean, Washington cannot get to its 2030 target by decarbonizing its grid like other states or regions can. Washington must decarbonize other sectors, such as transportation, earlier to meet the 2030 target.
Oregon established economy-wide emissions reduction goals of at least 45% below 1990 emissions levels by 2035 and at least 80% below 1990 levels by 2050. Compared to Washington, Oregon has both a less aggressive emissions target and more coal powering its electricity, so it can hit a more stringent 2030 target by removing coal from its electricity grid.
For Montana and Idaho, which lack state policy targets, the model set emissions reduction targets at 40% below 1990 levels in 2030 and net-zero in 2050. The non-CO2 emissions portions are larger in Idaho and Montana due to the significant agricultural sectors in those states.
Northwest Needs Negative Emissions Technologies to Reach Net-Zero
Early investment in negative emissions technologies—land-use measures, such as reforestation, that increase carbon storage in the natural environment; BECCS; and DAC—will be necessary to remove and sequester carbon. The visualization below shows emissions declining in the Northwest from 2021 to 2050. The positive side of the graph shows activities that contribute to emissions, while the negative side shows activities that can offset emissions, reported in MMT CO2 equivalent (CO2e).
This visualization also shows the CO2 stored in geologic sequestration and land sink after carbon removal by negative emissions technologies. Our analysis shows significant investment in negative emissions technologies to supply carbon for geologic sequestration, especially DAC in Montana by 2035. DAC is a cost-effective technology by 2035 largely due to generous Inflation Reduction Act incentives.
Regional Emissions Targets More Efficient than State Targets
The difference in emissions sources between the states shows how regional emissions targets would be more economically efficient than state-level emissions targets in the Northwest.
Idaho and Montana are modeled to achieve 40% emissions reductions by 2030. Because non-CO2 emissions make up a larger share of total emissions in these states, they must make deeper CO2 emissions cuts to achieve the 2030 target. The two states make earlier investments in clean fuels and carbon sequestration than Oregon and Washington do; these are higher-cost measures that drive up the average cost of emissions mitigation.
A regional target, though difficult to implement, would allow states to draw from lower-cost out-of-state emissions reduction measures to achieve the same 2030 targets. In the absence of a regional target, Idaho and Montana could benefit from an emissions reduction pathway that first targets electrification and decarbonizing electricity, and then targets emissions from remaining liquid fuels more gradually.


